
 ios
ios android
 tiktok
 instagram
 facebook
 bluesky
 x
x reddit
 threads
 About
About AKESO Health Tracker
 Resources
 Blog
Blog FAQ
FAQ Contact
 AKESO Forum
Adding custom charts
1. To add a new custom chart to your dashboard, first navigate to the chart settings menu using one of the methods outlined below.
Method 1: Scroll down your personal dashboard to find a convenient “Create new chart” button.
Tap this button to open the menu.

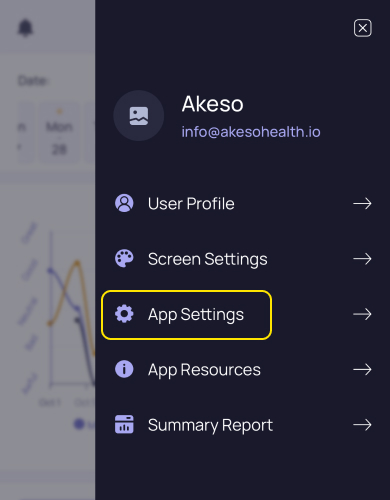
Method 2: Open your settings menu by tapping the triple bar (≡) icon in the upper-right corner of your screen.

Tap on “App Settings”.
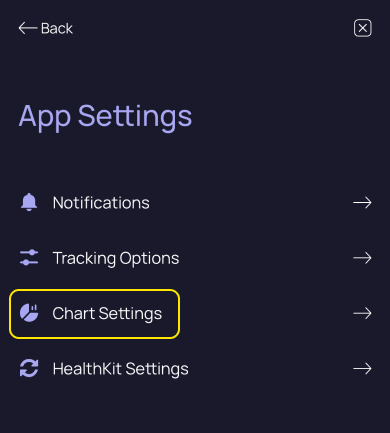
Then, Tap on “Chart settings”.
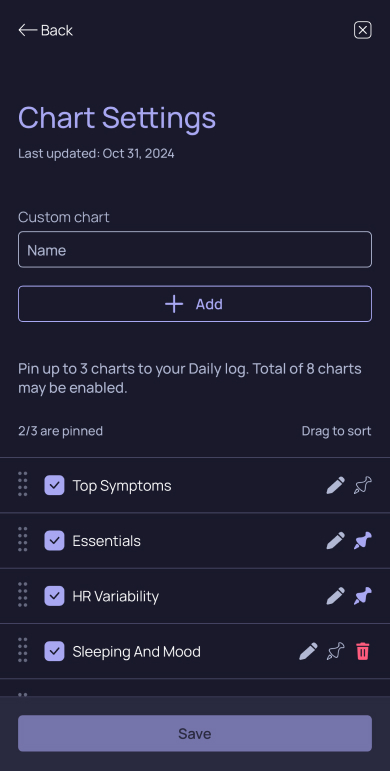
2. To start creating your custom chart, first, type your chart’s name into the “Custom chart” text box.

3. Once you’ve finished typing, tap on the “(+) Add Custom” button below the text box.

NOTE: At this time, you can only save 100 total charts to Akeso.
This limit includes all default and custom charts.
4. Your new chart will now appear at the bottom of your chart list.

IMPORTANT: New charts are toggled off by default.
5. New chart appears empty, so please customize it as you wish. Taping the pencil icon to the right of the chart’s name to open or close the edit chart menu.

a. Here, you have complete control over your charts. From the edit chart menu you can:
-
- Give your chart a unique name.
- Choose from one of Akeso’s seven chart types.
- Select chart parameters (if applicable).
- Pick the time period and date range to display saved data from.
- Choose which tracker data to include.
- Select which values to display (if applicable).
- Decide how to group your data (if applicable).
6. Once you have finished customizing turn on your new chart by pressing the square icon to the left of its name. You will know your chart is on when the check box displays a checkmark.

7. After make sure to press the illuminated “Save” button at the bottom of your screen to save your changes.
