
 ios
ios android
 tiktok
 instagram
 facebook
 bluesky
 x
x reddit
 threads
 About
About AKESO Health Tracker
 Resources
 Blog
Blog FAQ
FAQ Contact
 AKESO Forum
Your Akeso dashboard comes with three default charts to help you start visualizing your tracked health data.

At the top of your dashboard, you’ll find the “Top Symptoms” graph.
This straightforward pie graph showcases your top 7 symptoms for the current week. Use this chart to track your most common symptoms and compare their frequency.
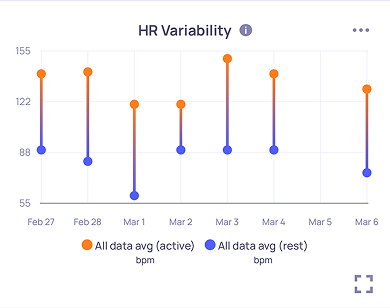
Below your “Top Symptoms” graph, you’ll find a simple “Heart Rate Variability (HRV)” chart.
This easy-to-read dumbbell chart displays your daily HRV for the current week. Use this information to check in on your autonomic nervous system (ANS) and see how well your body is responding to stress and recovering from physical activity.
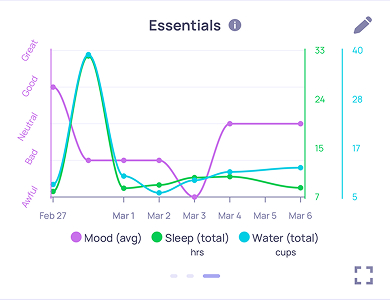
At the bottom of your dashboard, you will find a straightforward “Essentials” graph.
Use this simple line graph to easily spot correlations between your average hours slept, hydration levels, and overall mood for the current week.